
161: Three Profiling Tools
(view original Railscast)
This episode will show three different profiling tools that you can use with your Rails applications. They are all designed to work in development mode and while you should be careful not to do too much optimization and profiling while in development mode these tools can be really helpful in giving you an idea what Rails and your application are doing under the hood. Note that a couple of the tools are from commercial companies, but the versions we’ll be using are all free.
New Relic
New Relic is best known for its RPM monitoring tool which provides an excellent way of monitoring production Rails applications. Less well known is the developer mode version which can be used to see what’s going on in your application as you develop it.
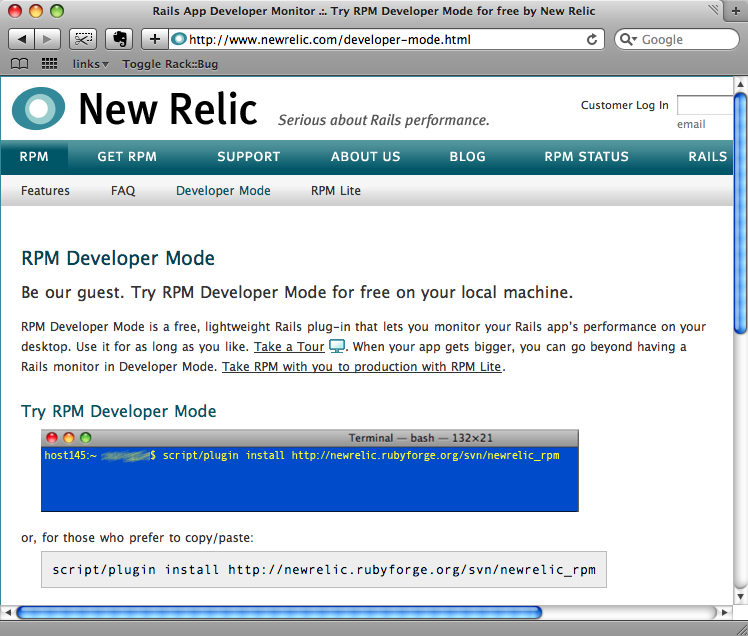
RPM Developer Mode is installed as a plugin. From the application’s directory we need to run
script/plugin install http://newrelic.rubyforge.org/svn/newrelic_rpm
to install it. Once it’s installed we can start up our application in development mode and visit some of the pages we’d like to profile. When we’ve done that we can visit http://localhost:3000/newrelic and we’ll see the requests that have been processed and the time taken for each one.
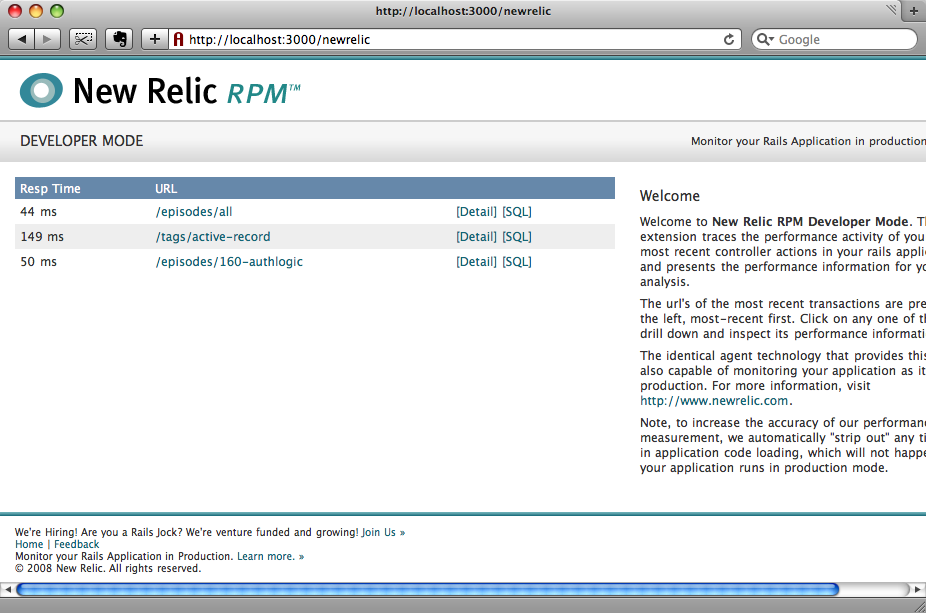
We can click on the details for any given request and view more details on how long each section of the page takes to render.
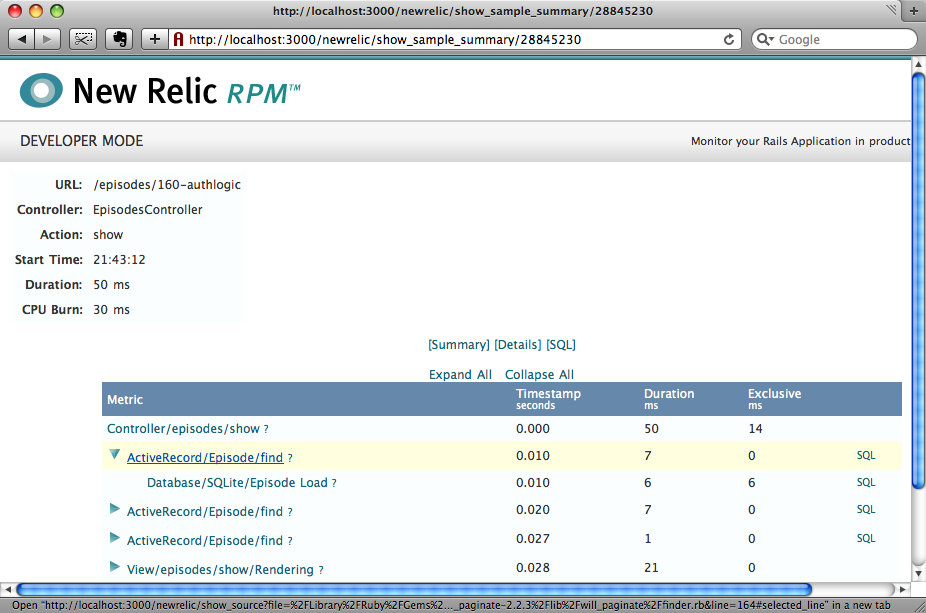
We can also see all of the SQL requests that are made for a given request.
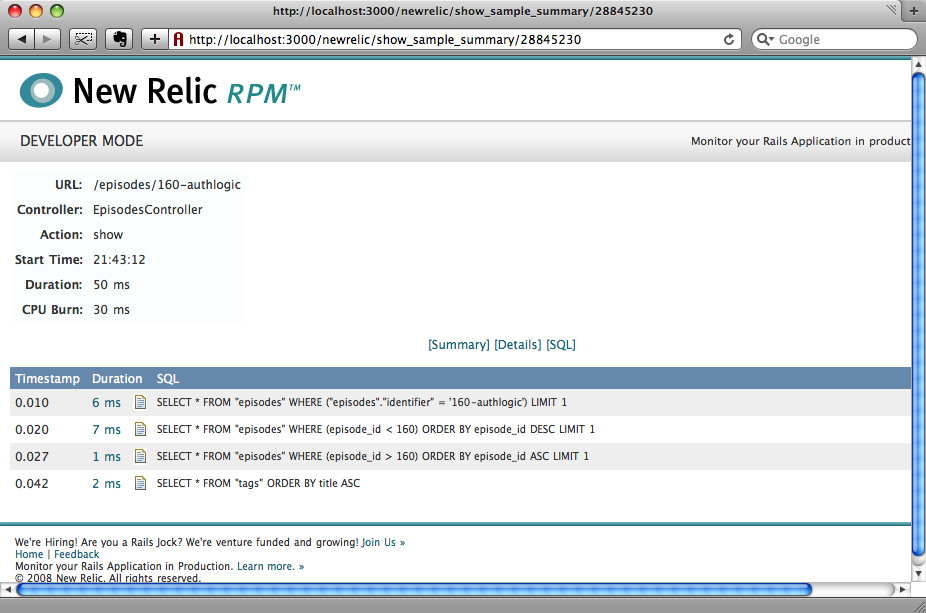
We can even view details for a single SQL call including a stack trace to show on which line in the application the request was made.
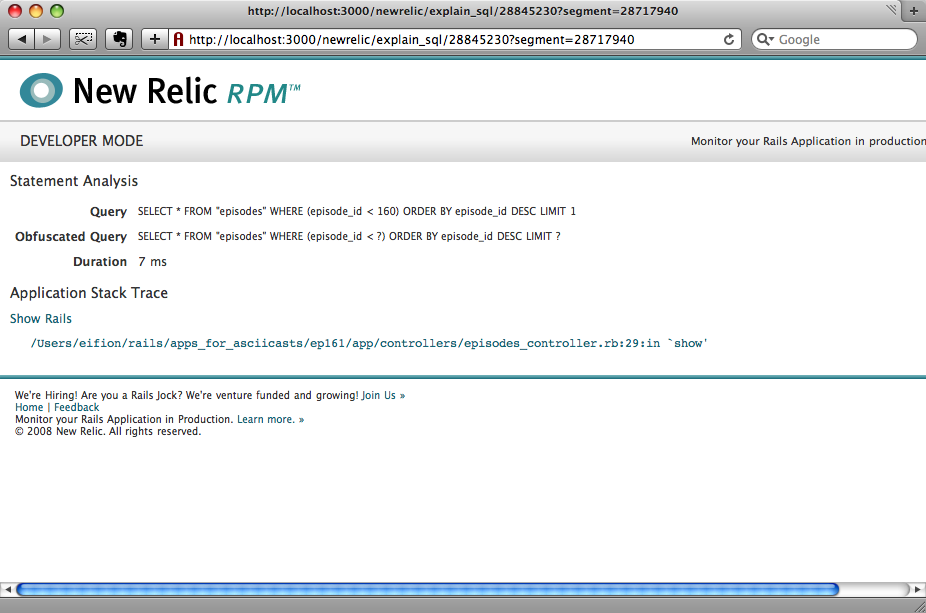
Overall NewRelic RPM can give you a lot of useful information about your application.
FiveRuns TuneUp
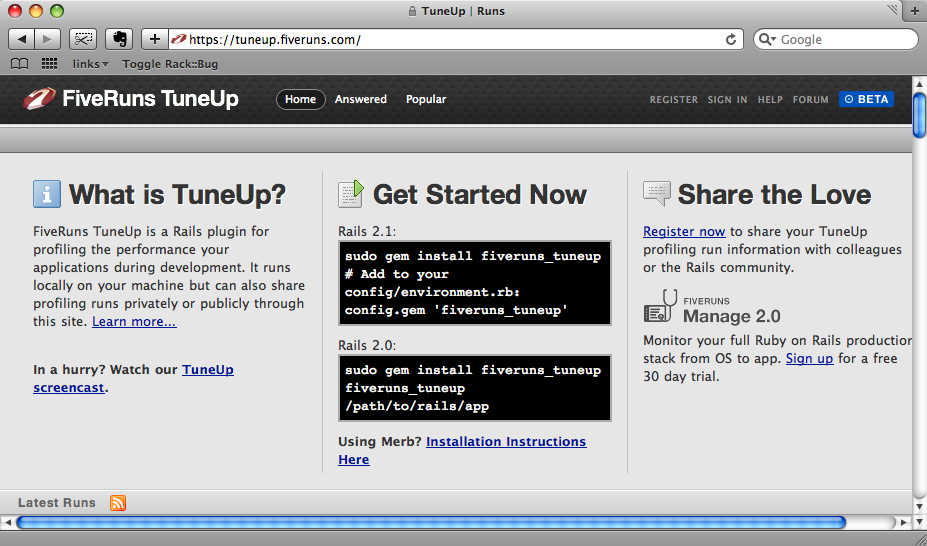
The next profiling tool we’ll demonstrate is FiveRuns TuneUp. Unlike RPM, this is installed as a gem.
sudo gem install fiveruns_tuneup
Once installed we can add TuneUp to our application by adding a reference to the gem in /config/environment.rb.
config.gem "fiveruns_tuneup"
Now, when we start up the server and visit a page in our application there will be an extra toolbar displayed at the top that will show us information about our application’s performance.
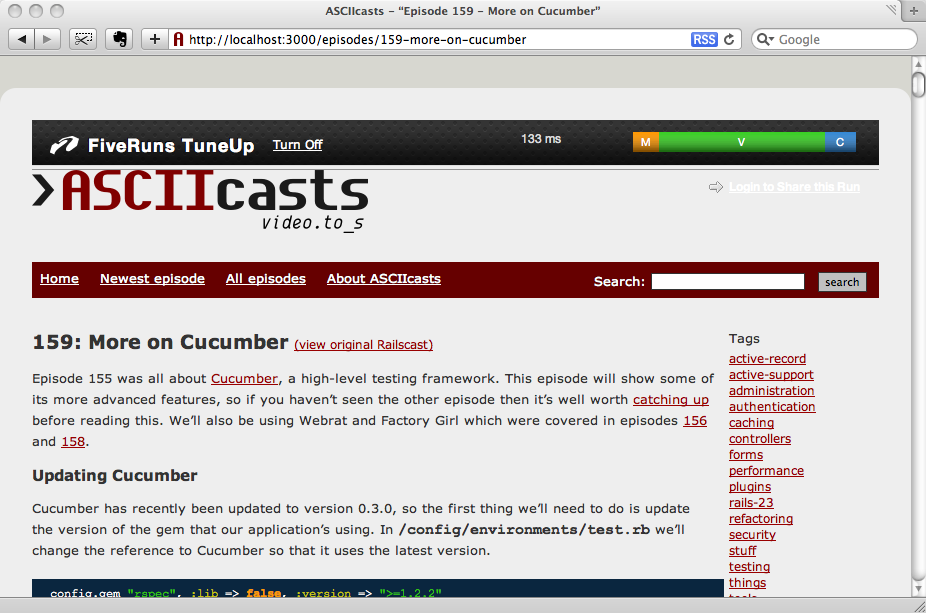
The toolbar shows the time taken to process the request and a breakdown of the relative time spent processing the models, view and controller.
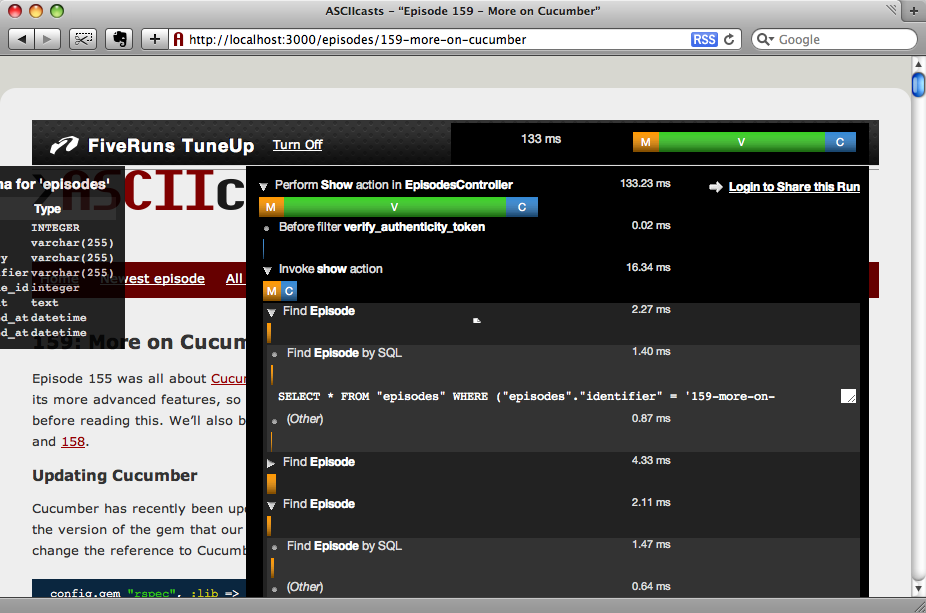
If we hover over the breakdown we’ll see more details about the different parts of the request including the time spent rendering the views and partials, and the time taken to make database calls. For the finds called by the models the generated SQL run against the database can be viewed and we can see the schemas for the database tables. Clicking the pencil icon next to a view will, if you have TextMate installed, take you to the exact lines of code where that rendering takes place.
If a request is running slowly and you’re not sure why you can click the “Login to Share this Run” on the toolbar and publish the request’s profile on FiveRuns website (either privately or publicly) and get help to optimize or debug it.
Rack::Bug
The final profiling tool we’ll cover is Rack::Bug. Like TuneUp it puts a toolbar at the top of the pages of your application that provides a wealth of information about each request. As it makes use of Middleware it can only be used with applications running under Rails 2.3 or later. Rack::Bug is installed as a plugin and can be installed from Github.
script/plugin install git://github.com/brynary/rack-bug.git
After installing the plugin we need to create a config/initializers/middleware.rb file that has the following content.
# config/initializers/middleware.rb
require "rack/bug"
ActionController::Dispatcher.middleware.use Rack::Bug,
  :ip_masks   => [IPAddr.new("127.0.0.1")],
  :secret_key => "epT5uCIchlsHCeR9dloOeAPG66PtHd9K8l0q9avitiaA/KUrY7DE52hD4yWY+8z1",
  :password   => "rack-bug-secret"
The secret_key and password values should be changed before using Rack::Bug. Once that’s done we can start up our server. To use Rack::Bug we’ll first need to visit a special path.
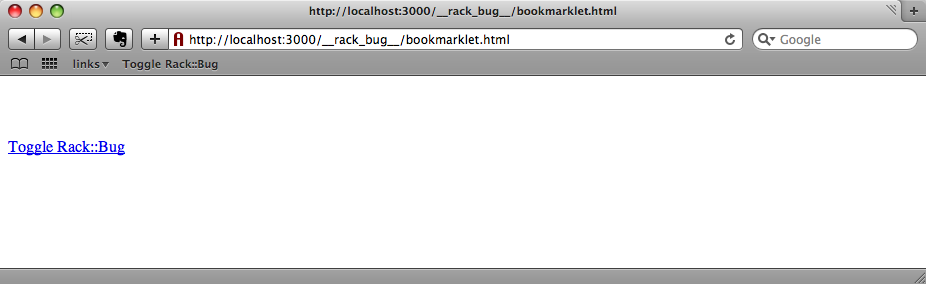
http://localhost:3000/__rack_bug__/bookmarklet.html
This path will take us to a page with nothing but a link on it. If we drag the link up to our bookmarks bar a bookmarklet will be created that will allow us to turn Rack::Bug on and off.
After we’ve created the bookmarklet we can visit a page in our application. Clicking the bookmarklet will bring up a dialog box in which we can enter the password we defined in the file above. When we do that an alert box that says “Rack::Bug Enabled” should appear. If we then refresh the page we’ll see the Rack::Bug toolbar at the top.
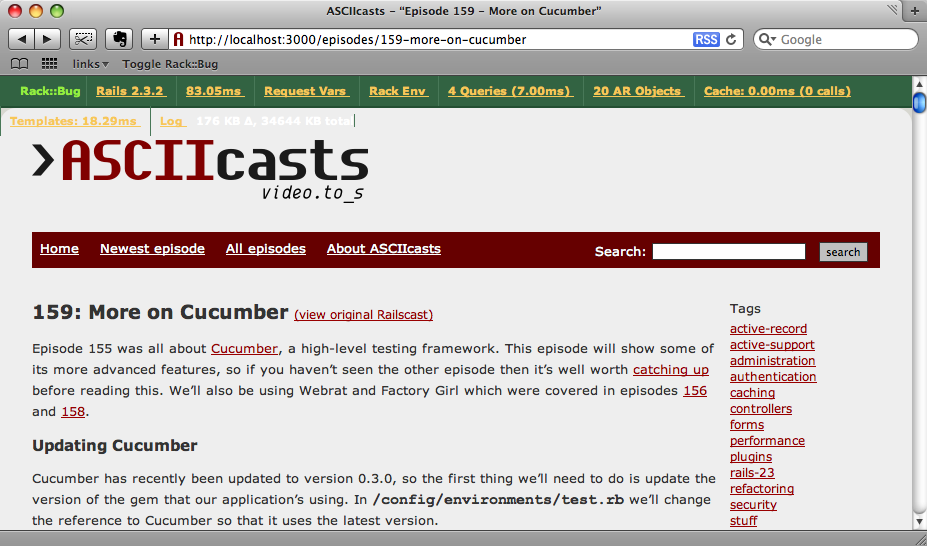
Each link in the toolbar opens up a panel that will show information about a different part of the request, from information about our Rails environment to a list of the request variables and the SQL queries that were made.
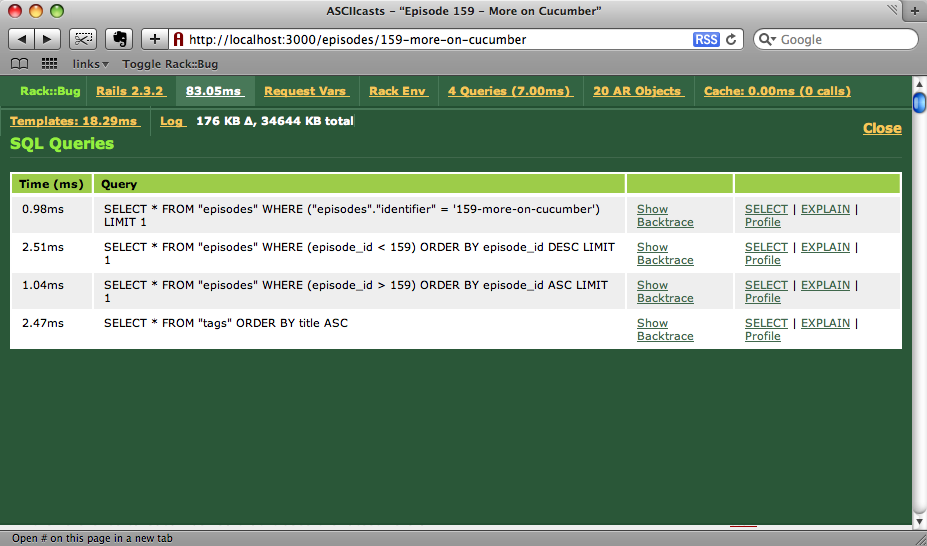
Other tabs let us view the number of ActiveRecord objects our request generates and the templates used to render the file.
Whichever profiling tool you choose for your Rails app you’ll find that it provides a host of useful information for understanding how your application is working. Remember though that it is that when your application is live and in production mode that you’ll gain the best understanding about how your application is performing.